
April 9, 202611 min read
What Is a PPM in Private Equity? Guide to Capital Raises Done Right
By Abhishek Bhanushali
Venture Capital

Disclaimer: This content is for educational purposes only and should not be considered as financial advice. Every business situation is unique, and we recommend consulting with qualified financial advisors before making important business decisions.
If you’ve raised institutional capital, your exit timeline is already being shaped by IRR, whether you track it or not.
Private equity investors don’t start with valuation optimism. They start with target IRRs and work backward. Entry price, dilution, exit timing, and IPO expectations are all reverse-engineered from return hurdles. When your CFO presents an 18-month IPO plan, investors are recalculating whether it clears a 25% IRR. When SEBI reviews your DRHP pricing logic, they’re assessing whether institutional allocations align with market-standard return assumptions.
This is why what is IRR in private equity is not a theoretical question. IRR is the annualised discount rate that equates actual cash flows, initial investment, follow-on rounds, interim distributions, and final exit proceeds. It is solved from real timelines, not forecasts.
For Indian promoters preparing Main Board or SME listings, IRR blind spots quickly surface: incomplete equity timelines, assuming the listing price equals the exit price, and ignoring currency impact for dollar-based funds. These gaps create pre-IPO friction long before markets do.
Before institutional capital enters your cap table, understanding the mathematics that drives investor behaviour becomes non-negotiable.
The internal rate of return (IRR) is the discount rate at which the net present value (NPV) of all cash flows (both inflows and outflows) equals zero. In private equity terms, it's the annualised return that makes an investor's initial capital deployment break even with the present value of distributions received.
Mathematically, irr calculation private equity follows this formula:
NPV = 0 = CF₀ + CF₁/(1 + IRR)¹ + CF₂/(1 + IRR)² + ... + CFₙ/(1 + IRR)ⁿ
Where:
This matters because IRR accounts for the timing of cash flows, not just their magnitude. A ₹100 crore exit in Year 3 generates higher IRR than the same ₹100 crore exit in Year 7, even if absolute returns are identical. For Indian promoters, this explains why PE investors pressure for faster exits and why delayed IPOs destroy institutional returns.
When S45 reconstructs the cap table history for enterprises preparing for IPO readiness, the first operational requirement is to produce timestamped cash flow documentation that enables accurate IRR calculations. Without this evidence base, DRHP pricing methodology becomes speculation rather than a defendable institutional logic.
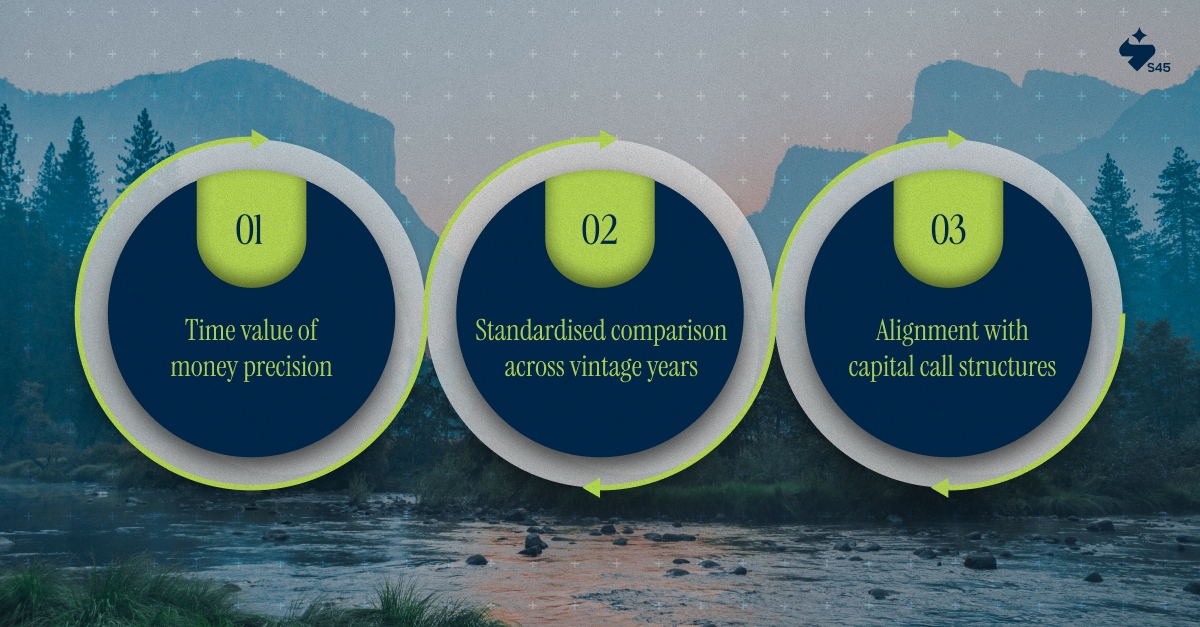
Private equity relies on IRR for three institutional reasons that directly affect how you price and structure pre-IPO rounds:
Unlike simple ROI, IRR acknowledges that capital deployed today costs more than capital deployed tomorrow. This matters in India's capital markets, where regulatory timelines, SEBI approval cycles, and listing delays routinely extend hold periods by 12 to 18 months. Each month of delay compresses the IRR, even as enterprise value grows.
IRR allows investors to compare a 2020 fund with a 2024 fund despite different deployment schedules, market cycles, and exit environments. Indian PE firms use this to benchmark their performance against global emerging-market funds. When institutional investors evaluate your company, they're comparing implied IRR to their fund-wide targets.
PE funds don't deploy capital upfront. They issue capital calls over 3 to 5 years as deals close. IRR calculation handles this irregular cash flow reality better than metrics that assume lump-sum investments. For Indian companies raising multiple tranches tied to milestone achievements, IRR provides the institutional-grade precision that matches investor economics.
Must Read: What Are Private Equity Firms? A Simple Guide for 2025
The theoretical understanding of IRR matters less than knowing how to calculate it accurately from your own cap table data.
In practice, the IRR private equity calculation is performed in Excel using either the IRR or XIRR function. The distinction directly affects valuation accuracy for Indian enterprises with irregular cash flow patterns.
The standard IRR function assumes cash flows occur at regular annual intervals. This creates distortion for:
The XIRR function solves this by accepting specific dates for each cash flow, calculating IRR based on actual calendar days between events. For Indian businesses raising institutional capital across multiple tranches with varying vesting and liquidity terms, XIRR provides the institutional-grade precision that matches how PE investors model their returns.
Example calculation structure:
Date | Cash Flow | Description |
01-Jan-2022 | (₹50 Cr) | Series A investment |
15-Jun-2023 | (₹30 Cr) | Series B tranche 1 |
20-Nov-2023 | (₹20 Cr) | Series B tranche 2 |
30-Sep-2026 | ₹175 Cr | IPO exit proceeds |
Using XIRR on these flows with actual dates produces the true time-weighted return. Using IRR with annual approximations can understate or overstate performance, depending on whether cash flows are concentrated early or late in the calendar year.
Private equity firms sometimes engineer dividend recapitalisations: borrowing against portfolio company assets to pay themselves dividends before exit. This inflates IRR without creating enterprise value because an early cash return reduces the time capital remains deployed.
For Indian promoters evaluating PE term sheets, this matters operationally. A firm offering 25% IRR with aggressive dividend recap rights may extract more cash pre-IPO than a firm targeting 28% IRR through patient value creation. The IRR looks similar, but the impact on your balance sheet, debt capacity, and IPO readiness differs dramatically.
Once you understand how to calculate IRR, the next operational question becomes: what return thresholds drive institutional investor behaviour in Indian capital markets?
Institutional benchmarks for a good IRR in the private equity sector cluster around specific ranges that reflect risk, liquidity, and regulatory complexity.
Indian PE target returns typically demand 22 to 24% gross IRR to compensate for:
These targets assume 4- to 7-year holding periods. When IPO timelines extend beyond 7 years (common in India due to SEBI backlogs, market windows, and readiness gaps), required entry pricing drops to maintain the target IRR. This is why delayed IPO preparation destroys valuation negotiating power.
Private equity irr benchmarks distinguish between gross IRR (fund-level performance before fees) and net IRR (returns to limited partners after fees and carry). Indian family offices and institutional investors evaluating PE fund commitments should expect net IRR 5 to 8% below gross figures.
If a PE fund markets 25% historical IRR, the actual net IRR to LPs likely sits around 17 to 20%. This gap exists because:
For promoters pricing institutional rounds, understanding this gap matters. When your PE investor demands entry pricing that implies 28% gross IRR, they're not being aggressive. They're targeting a 20% net IRR for their LPs after fees. Negotiating against gross IRR targets without understanding net IRR realities leads to valuation impasses.
Understanding what IRR measures is equally important as understanding what it doesn't measure. Relying solely on IRR creates strategic blind spots.
IRR for private equity fails as a standalone metric in three scenarios common to Indian capital markets:
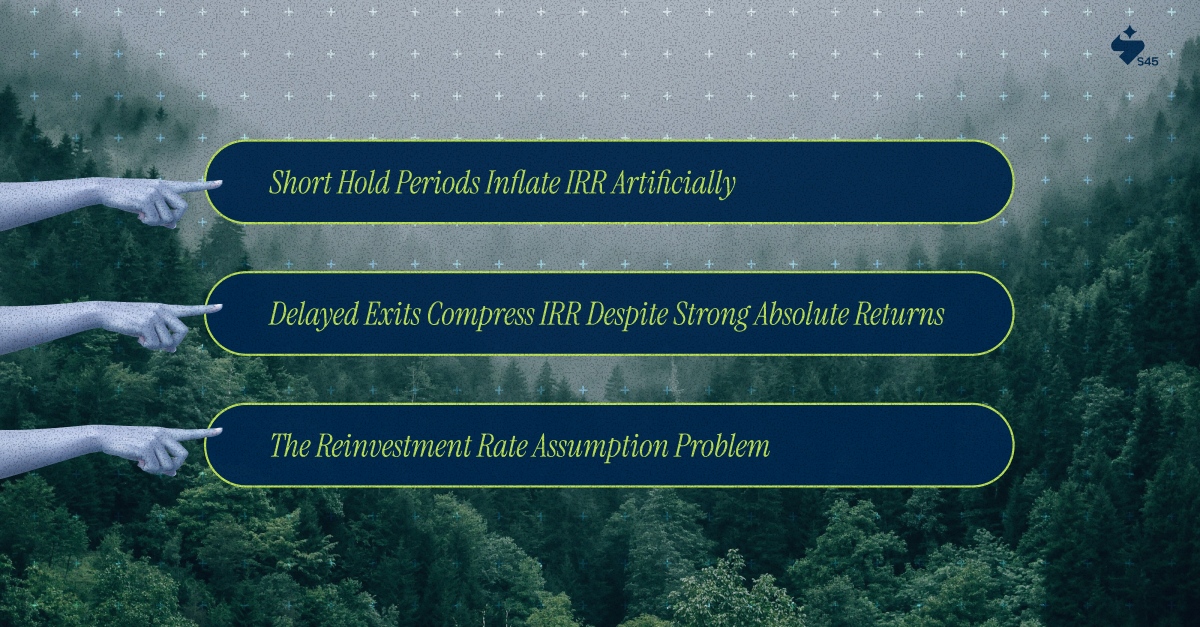
A PE investment that doubles in 2 years generates 41% IRR. The same investment, doubling in 5 years, yields a 15% IRR. But absolute returns (2x multiple) are identical.
For Indian enterprises evaluating quick exits via strategic sales versus patient IPOs, MOIC (Multiple on Invested Capital) provides clearer visibility into absolute returns. MOIC simply divides total value (distributions plus residual value) by invested capital. A 2.5x MOIC means investors get ₹2.50 back for every ₹1 invested, regardless of the timeframe.
If your business grows from ₹100 crore to ₹500 crore enterprise value over 8 years, but IPO delays push exit to Year 10, IRR drops from 22% to 17% even though value creation remained constant.
This explains why PE investors pressure for "readiness" even when business fundamentals haven't changed. Each quarter of IPO delay compresses their IRR, making entry pricing less attractive retroactively.
The IRR calculation assumes interim cash flows are reinvested at the same rate as the overall IRR. In reality, PE firms can't consistently redeploy capital at 25% returns. This makes IRR an optimistic measure for long-duration funds.
DPI (Distributions to Paid-In capital) solves the realisation problem.
It measures actual cash returned to investors divided by capital called. A fund with a 25% IRR but a 0.6x DPI hasn't actually delivered value. Indian promoters should evaluate PE investors' track records using both IRR and DPI to determine whether returns derive from valuation or liquidity.
When AI-driven investment banking platforms reconstruct cap tables for IPO readiness, the analysis should include IRR, MOIC, and projected DPI across different exit scenarios. This tri-metric approach reveals whether your institutional capital structure supports or sabotages realistic listing timelines.
The mathematics of IRR becomes a regulatory substance when SEBI reviews your offering document's pricing methodology.
SEBI's ICDR regulations don't explicitly mandate IRR disclosure, but institutional investor pricing methodology requires a defendable quantitative basis. When your DRHP explains why you priced QIP allocations or preferential allotments at specific valuations, the underlying logic connects to IRR expectations.
The evidence architecture required for IRR transparency in DRHP filings includes:
This isn't over-engineering. It's the difference between DRHP observations that are cleared in one comment cycle and those that trigger valuation methodology queries, related-party scrutiny, or pricing-justification requests.
Technology compresses IRR reconstruction timelines, but only when paired with banking judgement that understands regulatory implications.
AI-driven IRR analysis compresses the timeline from DRHP mandate to filing from 4 to 6 months to 30 to 45 days by eliminating manual cash flow reconstruction, valuation reconciliation, and scenario modelling. Platforms like S45 use proprietary AI systems to extract cash flows from hundreds of pages of shareholder agreements, calculate XIRR across irregular timestamps, and generate exit scenario matrices.
But AI without banker judgement fails because private equity irr calculation requires institutional context that algorithms don't inherently understand:
The operational value comes from AI handling mechanical precision, while experienced sector bankers provide the institutional overlay that decides which IRR disclosures strengthen your IPO narrative versus create regulatory exposure.
Also read: The Essential Credit Funding Guide for Indian SMEs: Scores, Risks & Smarter Decisions
Your choice of listing venue directly affects the IRR hurdles institutional investors demand at entry, which in turn affects your dilution and pricing power.
IRR expectations shift between Main Board and SME Exchange listings because liquidity profiles differ structurally:
Main Board listings offer institutional investors:
These liquidity advantages allow PE investors to accept marginally lower entry IRRs (22-25%) because exit execution risk decreases.
SME Exchange listings face different market realities:
To compensate, PE investors demand higher entry IRRs (25 to 30% range) or negotiate structured exits: promoter buybacks, put options, or phased secondary sales that don't depend solely on market liquidity.
For Indian enterprises choosing a listing venue, understanding these IRR dynamics is operationally important. SME listing may offer faster time-to-market, but pricing institutional rounds becomes more challenging when investors set higher IRR hurdles to offset liquidity risk.
The path from institutional capital to public markets requires integrating IRR considerations into venue selection, institutional allocation strategy, and post-listing liquidity design. "Successful IPO" isn't the listing day. It's 18 months later when PE investors have exited at returns that meet their IRR commitments to limited partners.
SEBI regulations rarely mention "IRR" explicitly, but the economic substance appears throughout disclosure requirements.
SEBI LODR and ICDR requirements don't use the term "IRR" in regulatory text, but the substance appears in critical disclosure areas:

Related party transaction disclosures (LODR Regulation 23): When PE investors also provide debt, vendor financing, or other commercial arrangements, IRR analysis reveals whether pricing reflects arm's length terms or engineered returns that distort reported institutional investor economics.
Preferential allotment pricing (ICDR Regulation 164): Formula-based pricing appears mechanical on paper, but when issuance terms include liquidation preferences, ratchets, or conversion features, the effective IRR to investors may differ materially from the headline price. Disclosure quality separates compliant-on-paper from institutionally credible.
Promoter contribution and lock-in (ICDR Regulation 32, 38): PE investors often negotiate shorter lock-ups than promoters. IRR modelling that assumes PE exits 12 months post-IPO while promoter shares remain locked for 36 months reveals whose economic interests the listing truly serves.
Great IPOs treat SEBI compliance as an opportunity to demonstrate capital structure discipline, institutional alignment, and pricing integrity. Mediocre IPOs view compliance as paperwork that gets "handled" by consultants who don't understand the IRR implications of the disclosures they're drafting.
For founders who've built enterprises over decades, IRR serves as the institutional translation layer between your business-building timeline and investor capital-deployment economics.
IRR literacy isn't about becoming a quantitative analyst. It's about understanding the language institutional capital uses to price risk, time, and liquidity.
When your PE investor references "25% target IRR," they're communicating several operational realities:
The friction between enterprise-building and IRR optimisation shows up when:
But founders who master IRR thinking gain a strategic advantage. You can structure PE rounds that align investor returns with business-building timelines. You can negotiate terms that balance high IRR with patient capital behaviour. You can identify which institutional investors' IRR requirements align with your IPO readiness horizon and which will create misalignment in pressure.
This isn't about optimising for investors at the expense of business fundamentals. It's about making institutional capital work for enterprise outcomes, rather than letting capital-structure chaos derail IPO execution.
IRR in private equity is operational infrastructure, not theoretical finance. For Indian enterprises preparing for public markets, understanding the IRR calculation of private equity mechanics determines whether your cap table supports or undermines IPO execution.
PE investors price entries and exits using IRR mathematics that assumes time value, compounds irregularly, and requires specific Excel functions (XIRR) to model accurately. Target IRR benchmarks (20-25% for buyouts, higher for venture) drive institutional investor behaviour regarding exit timing, pricing expectations, and strategic patience. IRR without MOIC creates blind spots; a 30% IRR from a 2-year hold sounds impressive until absolute returns reveal only a 1.7x multiple.
The path from institutional capital to public markets requires treating IRR as operational reality, not fundraising abstraction. Evidence beats opinion. Compliance is craftsmanship. Institutional clarity precedes regulatory clearance.
Before committing months and reputation to an IPO process built on fragmented cap table records and unmodelled IRR scenarios, enterprises need an institutional-grade reconstruction of their capital structure.
S45's IPO Readiness Scan validates investor economics, stress-tests exit assumptions, and provides the evidence architecture SEBI expects in pricing methodology disclosures. Schedule a readiness consultation now to learn more.
Discover more insights on similar topics