
April 9, 202611 min read
What Is a PPM in Private Equity? Guide to Capital Raises Done Right
By Abhishek Bhanushali
Venture Capital

Key Takeaways
Disclaimer: This content is for educational purposes only and should not be considered as financial advice. Every business situation is unique, and we recommend consulting with qualified financial advisors before making important business decisions.
Your board just wrapped up, and your PE investor dropped one number repeatedly: their fund’s DPI. Three mentions in thirty minutes. You nod along, but do you really know why it matters?
In 2024, India saw $33 billion in exit activity, with public market exits accounting for nearly 55% of the total. For founders and CFOs of PE-backed companies, this is a big opportunity, but the pressure is real. Investors aren’t looking at revenue growth or EBITDA; they’re watching DPI, the only metric that shows actual cash returns.
A misread here isn’t theoretical. It can force premature IPOs, create avoidable board tension, or leave your investors scrambling to manage expectations, all while you try to keep timelines and valuations on track.
This blog explains what DPI in private equity is, why it matters, and how it interacts with other PE metrics so that you can approach your next board meeting with clarity and confidence.
DPI (Distributions to Paid-In Capital) is a private equity performance metric that measures the cash returned to investors relative to the capital they have contributed.
In simple terms, DPI answers one question:
How much money has come back, so far, for every rupee invested?
It is calculated as a multiple, not a percentage.
Unlike IRR or valuation-based metrics, DPI counts only realized outcomes, dividends, partial exits, secondary sales, and IPO proceeds that have actually been distributed. It excludes unrealized gains, projected exits, and mark-to-model valuations.
This is what makes DPI especially important for founders, CFOs, and board members navigating liquidity events. While IRR and TVPI can look strong on paper, DPI reflects whether capital has truly moved from private risk to realized cash.
In practice, DPI becomes most relevant when companies approach:
At this stage, DPI ceases to be a fund metric and becomes an execution metric. It reveals whether financial structuring, compliance readiness, and market timing are converting private value into institutionally defensible returns, or merely postponing them.
Also Read: Decoding Private Equity Metrics for Founders
Investors constantly monitor DPI, yet many founders and CFOs don’t fully grasp its implications. Ignoring it can create surprises around exits, distributions, and board discussions.

Here’s why DPI deserves your attention:
S45 works with founders to assess how upcoming liquidity events will affect realized outcomes. By providing institutional clarity on IPO readiness and execution pathways, S45 helps companies prepare for public markets.
With the stakes clear, let’s break down how to calculate DPI so you can see the cash that truly matters to investors.
Also Read: A Complete Guide on Private Investment in Public Equity (PIPE)
Calculating DPI is easy, but getting it right requires precision in defining both numerator and denominator.
DPI = Cumulative Distributions ÷ Paid-In Capital
Cumulative distributions include all cash returned to LPs through:
All distributions are calculated net of management fees and carried interest, giving LPs an accurate picture of cash actually received.
Example 1: Mid-Stage Fund with Partial Exits
A PE fund calls $50M from its LPs over three years. By year five:
DPI = $15M ÷ $50M = 0.3x
This 0.3x DPI tells you the fund has returned 30 cents on every dollar invested. Not impressive for a five-year-old fund, but typical if most holdings remain unrealized and exits are just beginning.
Example 2: PE-Backed SaaS Company Approaching IPO
A Bengaluru-based enterprise software company raised $20M from a PE fund in 2021. The fund is $150M in total across its portfolio. By 2024:
Current DPI = $53M ÷ $150M = 0.35x
Post-IPO DPI = ($53M + $18M) ÷ $150M = 0.47x
Your IPO alone would lift the fund's DPI by 0.12x, representing a 34% improvement in realized returns. This explains why your investor focuses intensely on execution precision. A failed or delayed IPO doesn't just hurt your company; it stalls the entire fund's liquidity profile.
What matters across all scenarios is that cash is actually returned to LPs, not paper gains or valuation markups.
Also Read: Private Equity Law Key Regulations, Structures, and Risks
Private equity performance is evaluated using multiple metrics, each designed to answer a different question. Understanding how DPI compares to IRR, TVPI, RVPI, and MOIC helps founders and finance leaders interpret investor expectations more accurately.
Metric | Full Form | What It Measures | Formula | Key Insight |
DPI | Distributions to Paid-In Capital | Realized returns (cash distributed) | Cumulative Distributions ÷ Paid-In Capital | Accounts for distributions net of fees; hardest to manipulate. |
TVPI | Total Value to Paid-In Capital | Total value (realized + unrealized) | (Distributions + Residual Value) ÷ Paid-In Capital | Includes estimated fair value of unrealized investments; depends on valuation assumptions. |
RVPI | Residual Value to Paid-In Capital | Unrealized value remaining | Residual Value ÷ Paid-In Capital | Provides an estimate of future cash flows and potential liquidity events. |
IRR | Internal Rate of Return | Time-adjusted returns | Discounted cash flow analysis | Sensitive to timing; delays in distributions materially impact calculations. |
MOIC | Multiple on Invested Capital | Gross cash-on-cash multiple | Total Value ÷ Invested Capital | Expresses gross returns before fees, whereas DPI is net of expenses. |
Each metric serves a distinct analytical purpose. DPI becomes increasingly essential as funds mature and companies approach liquidity events, while the others help contextualize growth, timing, and remaining exposure.
However, like any metric, DPI has its strengths and limitations. Understanding both helps founders interpret it wisely rather than react blindly.
DPI is often treated as a definitive measure of private equity performance because it focuses on realized outcomes. In practice, its usefulness depends on when it is applied and how it is interpreted alongside other metrics.
Used correctly, DPI brings clarity to liquidity discussions. Used in isolation, it can oversimplify performance.
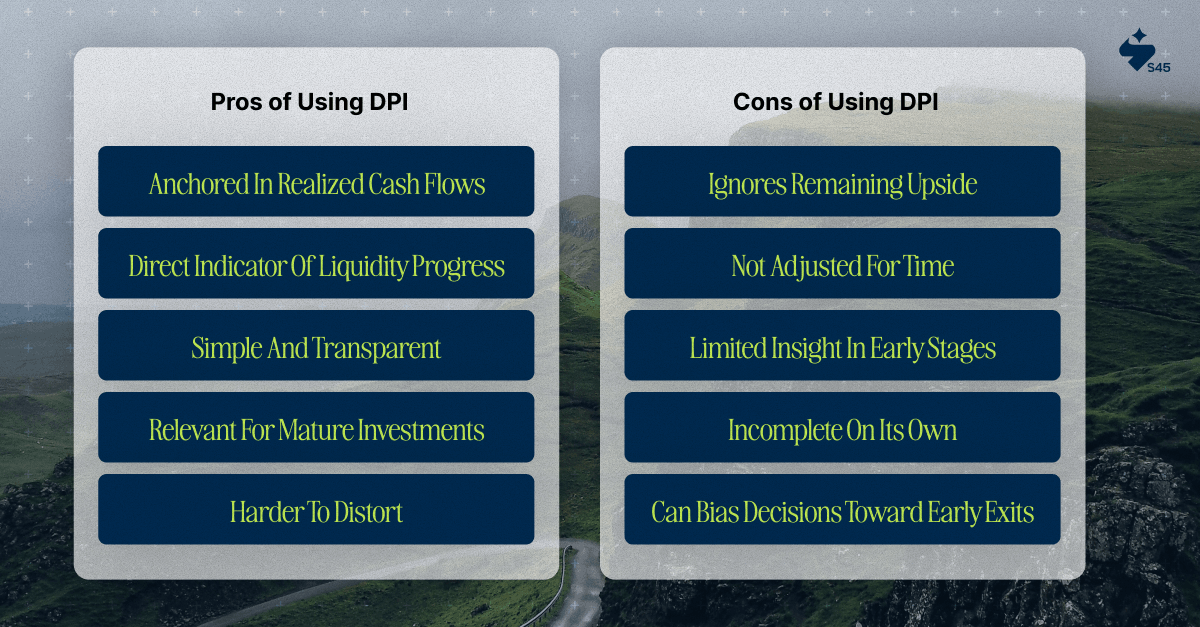
DPI is most effective when interpreted within a broader performance framework rather than as a standalone judgment.
Also Read: Understanding How GPs and LPs Drive Private Equity Growth
Every discussion about DPI comes down to one question: how do you turn unrealized value into real distributions without compromising valuation or credibility?
For most traditional banks, the answer is “fill out the paperwork and hope for the best.” They run long DRHP timelines, rely on disconnected spreadsheets, and leave founders reacting to SEBI queries and board pressure. Meanwhile, your investors are watching their DPI, and you’re stuck between wanting speed and needing discipline.
S45 works differently. We help mid-market companies in India go public with control, clarity, and execution precision, ensuring liquidity events deliver for investors and founders alike.
We help you with:
Timing and readiness determine whether an IPO actually improves DPI. Many delays happen because gaps are discovered too late. Our IPO Readiness Scan flags the risks before you file a single document:
We then build a realistic timeline with clear milestones. As a result, your company moves from “thinking about an IPO” to DRHP-ready. Investors get predictable distributions. You get control over timing and execution.
Regulatory delays crush DPI. When information isn’t traceable or transparent, SEBI observations appear, and pricing suffers. Our AI-driven drafting platform links every financial claim directly to source documentation.
The gap between private and public valuations often erodes DPI. If your IPO prices below your investor’s book value, distributions are lower than expected.
S45 closes that gap by mapping institutional appetite and aligning your pricing:
This gives both founders and investors visibility into likely outcomes before the bookbuild. Everyone knows what to expect, and surprises are minimized.
Moreover, we work alongside your team and PE sponsors to make exit planning deliberate rather than reactive. Our goal is to turn private performance into public market outcomes without compromising speed, discipline, or credibility.
DPI in private equity directly affects your boardroom discussions, your investors’ decisions, and your company’s exit timing. How much cash has actually returned to your investors influences whether your IPO moves forward, whether secondary sales are prioritized, and how valuations are viewed.
Small missteps in execution, compliance, or disclosure can slow distributions and create tension between founders and investors. The companies that get it right plan ahead, track outcomes precisely, and align execution with investor expectations.
S45 helps mid-market companies turn private performance into predictable public outcomes. Our IPO Readiness Scan, AI-driven DRHP drafting, and capital market execution services ensure your liquidity events deliver as expected while keeping you in control of timing and strategy.
Connect with us to map your exit timeline, align with investor DPI, and execute with confidence.
Discover more insights on similar topics